Key Stage 2 2018 – 2019 Results.
Key stage 2 (end of primary school) results
Average progress scores in reading, writing and maths:
- Reading Progress Score 5.41 (well above)
- Writing Progress Score 0.34 (Average)
- Maths Progress Score 2.44 (Above Average)
Average ‘scaled scores’ in reading and maths:
- Reading Average Scaled Score 109.8 (Local Authority Average = 105.0 and National Average = 104.4)
- Maths Average Scaled Score 107.5 (Local Authority Average = 105.7 and National Average = 105.0)
Percentage of pupils who achieved the expected standard or above in reading, writing and maths:
- 83% of pupils achieved the expected standard or higher in Reading, writing and maths combined.(Local Authority Average = 67% and National Average = 65%)
Percentage of pupils who achieved a high level of attainment in reading, writing and maths:
- 17% of pupils achieved the higher standard in Reading, Writing and Maths combined.
(Local Authority Average = 10% and National Average = 11%)
Key Stage 2 2017 – 2018 Results
Key stage 2 (end of primary school) results
Average progress scores in reading, writing and maths
- Reading Progress Score 5.52 (Well Above Average)
- Writing Progress Score 2.56 (Above Average)
- Maths Progress Score 4.31 (Well Above Average)
Average ‘scaled scores’ in reading and maths
- Reading Average Scaled Score = 109.4 (Local Authority Average = 106.3 and National Average = 105.0)
- Maths Average Scaled Score = 107.3 (Local Authority Average = 105.2 and National Average = 104.4)
Percentage of pupils who achieved the expected standard or above in reading, writing and maths
- 85 percent of pupils achieved the expected standard or higher in Reading, writing and maths combined.(Local Authority Average = 71% and National Average = 64%
Percentage of pupils who achieved a high level of attainment in reading, writing and maths
- 15% of pupils achieved the higher standard in Reading, Writing and Maths combined.(Local Authority Average = 10% and National Average = 10%)
End of Academic Year 2016 – 2017
Key Stage 2 (End of Primary School) Results
Percentage of pupils achieving the expected standard in Reading, Writing and Maths combined = 76%
(National Average 61%)
Percentage of pupils achieving the higher standard in Reading, Writing and Maths combined = 17%
(National Average 9%)
Average Progress Score in Reading = +5.45 (Well Above National Average)
Average Progress Score in Writing = +2.69 (Above National Average)
Average Progress Score in Maths = +2.52 (Above National Average)
Average Scaled Score in Reading = 108.1
(National Average for Reading = 104.1)
Average Scaled Score in Maths = 105.4
(National Average for Maths = 104.2)
End of Academic Year 2015 – 2016
Key Stage 2 (End of Primary School) Results
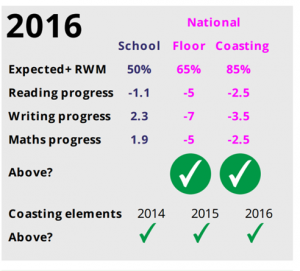
Average Progress Score in Reading -1.1
Average Progress Score in Writing 2.3
Average Progress Score in Mathematics 1.9
Average Scaled Score in Reading = 100.7
Average Scaled Score in Mathematics = 104.0
Percentage of pupils who achieved the expected standard or above in Reading = 50%
Percentage of pupils who achieved the expected standard or above in Writing = 85%
Percentage of pupils who achieved the expected standard or above in Mathematics = 90%
Percentage of pupils who achieved a high level of attainment in Reading = 25%
Percent of pupils who achieved a high level of attainment in Writing = 25%
Percentage of pupil who achieved a high level of attainment in Mathematics = 15%
End of Academic Year 2014 – 2015 Key Stage Two
RAISEonline Data
(unvalidated data at this point in the academic year)
71% of pupils achieved level 4 or above in Reading, Writing and Mathematics.
96% of pupils made expected progress in Mathematics.
89% of pupils made expected progress in Reading.
89% of pupils made expected progress in Writing.
27% of pupils achieved level 5 or above in Reading Writing and mathematics.
40% of pupils achieved level 5 or above in Mathematics.
50% of pupils achieved level 5 or above in Reading.
33% of pupils achieved level 5 or above in Writing.
Assessment Results For End Of Key Stage Two (Year 6)
| |
Below Level |
Level 3 |
Level 4 |
Level 5 |
Level 6 |
| Maths |
|
3.45% |
55.17% |
27.59% |
13.79% |
| Reading |
|
13.79% |
34.48% |
51.72% |
|
| SPAG |
|
13.79% |
37.93% |
48.28% |
|
| Writing |
3.45% |
13.79% |
48.28% |
34.48% |
|
(Note: These results are calculated for a class of 29 pupils as one pupils will be removed from our data in the autumn term. )